What Is the Wilshire 5000 Index?

When diving into the world of stock exchanges and investing, you will quickly encounter alphabet soups of acronyms and ticker symbols. While the Dow Jones Industrial Average and the S&P 500 dominate evening news broadcasts, seasoned investors and economists look toward a much broader indicator to gauge the true pulse of the American economy: the Wilshire 5000 Total Market Index.
If you have ever wondered how the entire United States equity market performs as a single cohesive unit, understanding the Wilshire 5000 is essential. Designed to measure virtually all publicly traded companies headquartered in the U.S., it serves as the ultimate benchmark for American capitalism.
What Is the Wilshire 5000 Index?
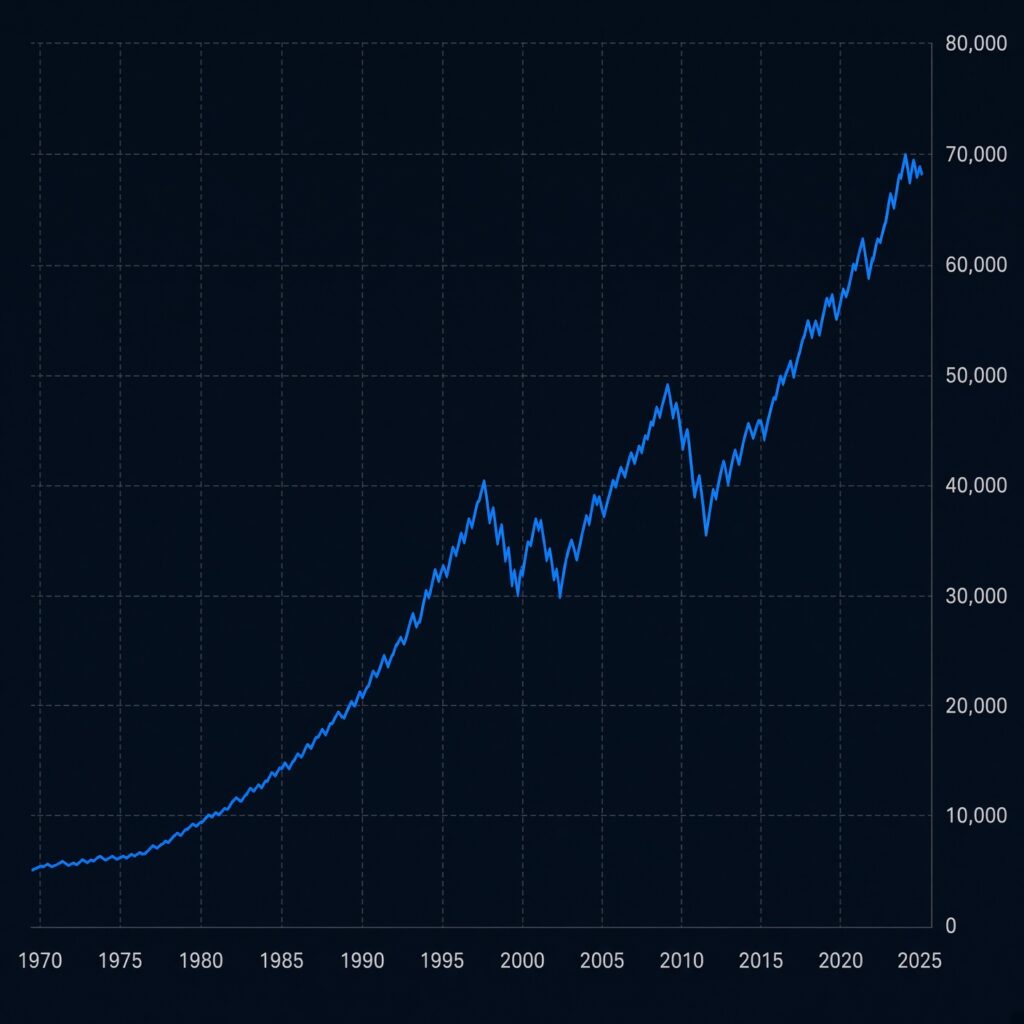
The Wilshire 5000 Index (often simply called the Wilshire 5000) is a market-capitalization-weighted index designed to measure the performance of all U.S. equity securities that have readily available price data. Unlike narrower indexes that focus only on massive corporations or elite groups of stocks, the Wilshire 5000 captures large-cap, mid-cap, small-cap, and micro-cap stocks alike.
To put it simply: if a company is publicly traded on a major U.S. stock exchange—such as the New York Stock Exchange (NYSE) or Nasdaq—and meets basic liquidity criteria, it is generally included in the index. This makes it the broadest measure of the U.S. stock market available today, encapsulating tens of trillions of dollars in total market value.
History and Evolution of the Index
The Wilshire 5000 was launched in 1974 by Wilshire Associates, with historical data back-calculated to December 1970. At its inception, the number 5000 was chosen because it roughly approximated the total number of publicly traded companies in the United States at the time.
Over the decades, the index has experienced fascinating shifts:
- The Dot-Com Era Peak: During the tech boom of the late 1990s, the number of components surged, reaching an all-time high of 7,562 companies on July 31, 1998.
- Market Consolidation: Following the turn of the millennium, wave after wave of mergers, acquisitions, and a slowdown in initial public offerings (IPOs) caused the total count of public U.S. companies to shrink.
- Modern Composition: Today, the index tracks thousands of issues, fluctuating based on market dynamics, corporate spin-offs, and regulatory environments. Despite having fewer than 5000 components in recent years, it retains its iconic name due to its historical recognition.
How the Wilshire 5000 is Weighted and Calculated
Understanding how an index is calculated helps you understand how your investments move. The Wilshire 5000 is a market-capitalization-weighted index, meaning larger companies carry significantly more weight than smaller ones.
For example, a tech giant worth trillions of dollars will move the index substantially more than a small-cap manufacturing firm worth $50 million. Over time, Wilshire introduced different versions of the index to cater to varying analytical needs:
- Float-Adjusted Capitalization: This version only counts shares that are actively available to the public for trading, excluding locked-in insider or government holdings.
- Full Capitalization: This accounts for every single share outstanding.
- Total Return vs. Price Return: Total return versions assume that all dividends are reinvested back into the index, providing an accurate picture of long-term investor wealth creation.
Wilshire 5000 vs. S&P 500 vs. Dow Jones: What’s the Difference?
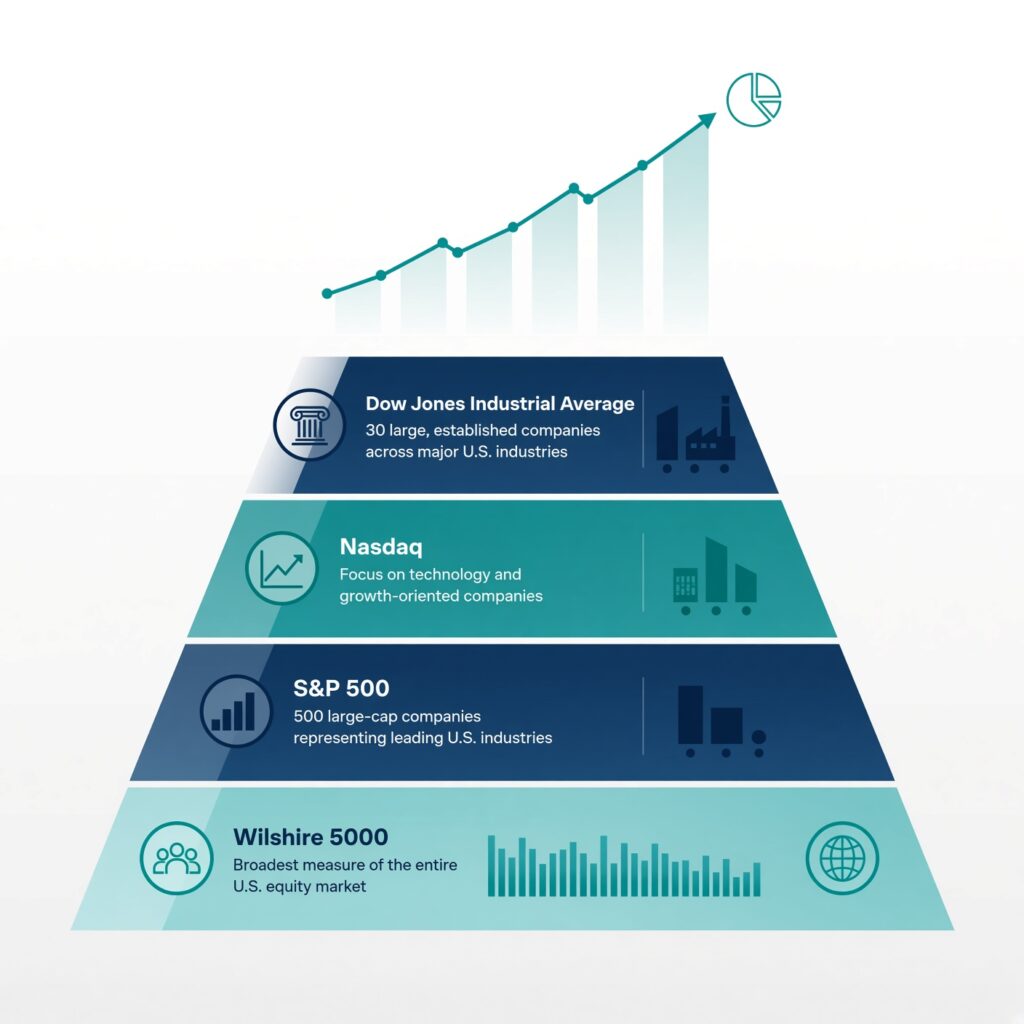
Beginners often confuse major stock market indexes. To master your understanding of the financial landscape, it helps to compare them side by side:
| Feature | Wilshire 5000 | S&P 500 | Dow Jones Industrial Average |
| Scope | Total U.S. Stock Market | 500 Large-Cap Giants | 30 Blue-Chip Stocks |
| Diversification | Massive (Includes small & micro caps) | High (Large and mid-caps) | Low (Concentrated selection) |
| Weighting Type | Market-Cap Weighted | Market-Cap Weighted | Price-Weighted |
| Primary Purpose | Measuring total economic health | Tracking blue-chip large-cap performance | Historic snapshot of industrial giants |
While the S&P 500 captures roughly 80% of the total U.S. stock market value due to its heavy-hitting corporate members, the Wilshire 5000 fills in the remaining gaps by giving a voice to smaller, high-growth domestic enterprises.
Why the Wilshire 5000 Matters to Everyday Investors
You might wonder why you should care about an index tracking thousands of stocks if you cannot buy shares of the index directly. The Wilshire 5000 serves several vital functions:
- The Ultimate Economic Barometer: When analysts want to know whether the entire American corporate ecosystem is expanding or contracting, they look at the total market value tracked by the Wilshire.
- Portfolio Benchmarking: Professional fund managers use the Wilshire 5000 to evaluate whether their active stock-picking strategies are actually beating the broader market.
- Valuation Insights: Long-term investors often compare the total market cap of the Wilshire 5000 against U.S. Gross Domestic Product (GDP)—a metric famously popularized as the “Buffett Indicator”—to determine whether the stock market is overvalued or undervalued.
How to Gain Exposure to Total Market Indexes
Because you cannot purchase an index directly, financial providers created alternative investment vehicles that mirror total market behavior. If you want your portfolio to track the broad U.S. market in a manner similar to the Wilshire 5000, you can look into total stock market index funds and Exchange-Traded Funds (ETFs).
Products such as total market funds offered by major brokerages track comprehensive indexes (like the Morningstar US Total Market Index or S&P Total Market Index) which behave almost identically to the Wilshire 5000. By purchasing a single total market ETF, you instantly spread your money across thousands of companies across technology, healthcare, finance, consumer goods, and energy sectors.
Advantages and Limitations of Total Market Investing
Every investing strategy comes with trade-offs. Examining the pros and cons of broad-market benchmarks helps clarify whether this approach fits your financial goals.
The Advantages
- Instant Diversification: You eliminate single-stock risk. If one company goes bankrupt, your portfolio absorbs the shock because you own thousands of others.
- Lower Costs: Broad index funds typically feature minimal expense ratios because they are passively managed.
- No Need to Pick Winners: You do not have to spend hours analyzing balance sheets or guessing which tech startup will conquer the industry. You simply bet on the aggregate growth of the American economy.
The Limitations
- Market Slumps Impact Everything: Because total market indexes own everything, a widespread economic recession will drag down your entire portfolio.
- Capitalization Bias: Since the index is market-cap weighted, massive technology monopolies still dictate the majority of the movement, meaning small-cap stocks won’t always save your returns during a large-cap tech downturn.
Final Thoughts
The Wilshire 5000 Index remains a cornerstone of financial analysis. By striving to capture every corner of the publicly traded U.S. equity market, it provides a transparent, unfiltered look at the health, wealth, and trajectory of American business. Whether you are building a long-term retirement portfolio or simply expanding your financial literacy, understanding total market benchmarks like the Wilshire 5000 empowers you to navigate the stock market with confidence.